One Page GSC + GA4 Data Merging Looker Report

Most basic GSC+GA4 joins you find on Google are limited to URL-level matching. This is often too basic and creates more problems than it solves.

Joining raw URLs without proper cleaning frustrates SEO teams because both sources contain “garbage” data—such as parameters, duplicates, and redirects—that lead to messy data and wrong conclusions.

This report moves beyond simple matching. By integrating GSC, SEO Sitemap, and GA4 data, it simplifies how you consolidate and evaluate content performance.

This allows site owners to define their own content groups based on segments and user intent, providing a much clearer analysis of overall performance.

To ensure your URL, Segment, Intent, and KeyEvent data map correctly, learn How To Prepare Google Sheet For BigQuery Integration before connecting your mapping tables to BigQuery.

Table of Contents

1. Sidebar Menu

Use the Sidebar Menu to change how your data is organized. While the Top Charts always show your overall traffic trends, clicking a sidebar option will update the Table at the bottom to show insights by URL, Segment, or Intent.

1.1 By URL (Overview)

  • The Goal: Deep-dive into individual page performance.
  • What it shows: Every single URL path is listed alongside its specific GSC and GA4 metrics.
  • Best for: Identifying exactly which blog post or landing page is your “Top Performer” and which pages need urgent SEO optimization.

1.2 By Segment (Similar Content Grouping)

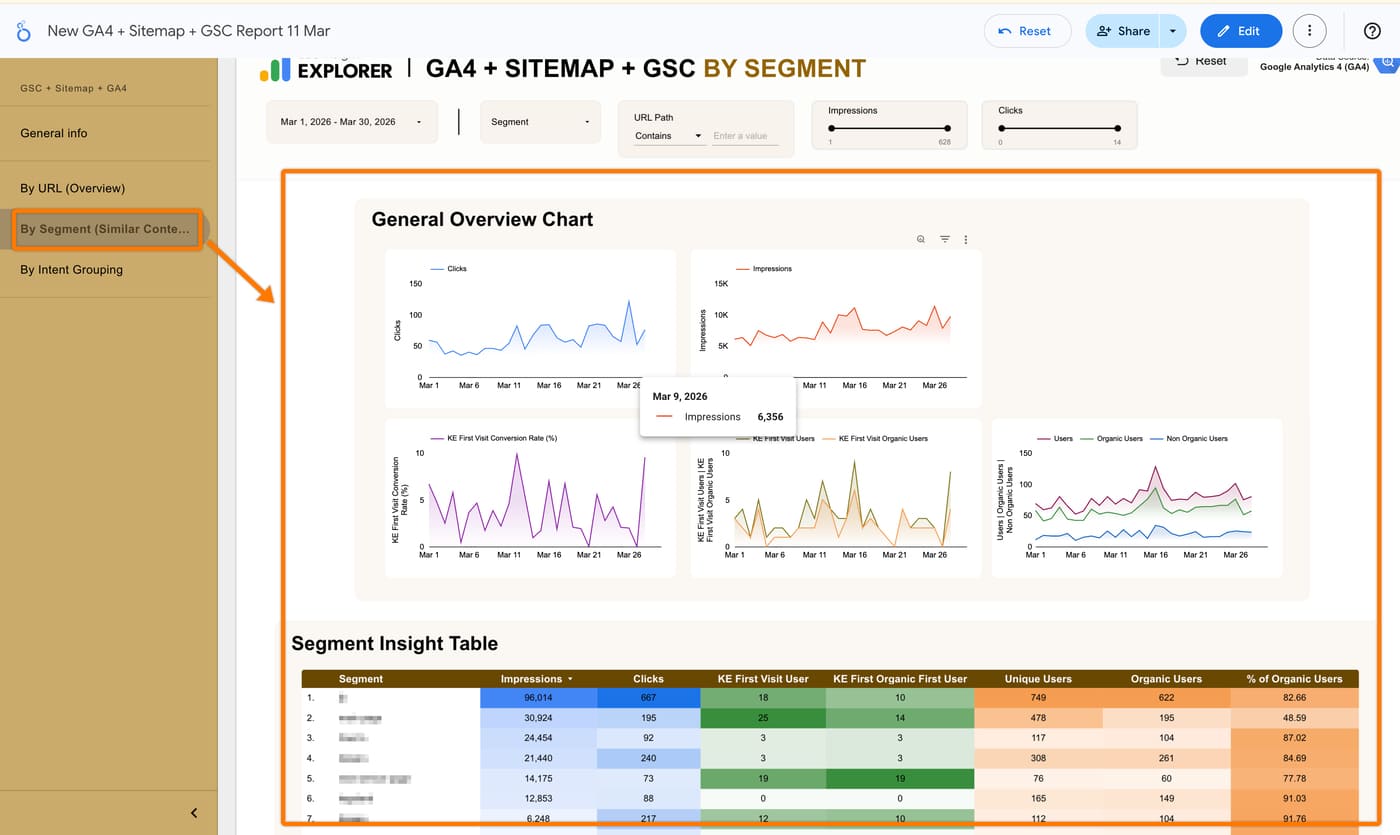
  • The Goal: Analyze performance by content categories or themes.
  • What it shows: Data is grouped by your custom “Segments” (e.g., “best iphone”, “main page”, “ninja toys”).
  • Best for: Understanding which broad topics are driving the most traffic. For example, you can see if your “Desaru” content cluster is outperforming your “JB” cluster, helping you decide where to invest more writing resources.

1.3 By Intent (Content Grouping)

  • The Goal: Align your SEO results with user psychology.
  • What it shows: Content is grouped by user intent (your can customize the input base on your own preference).

Best for: This view helps you see if “Informational” intent pages are actually leading to “Transactional” actions (Key Events), ensuring your content strategy matches the buyer’s journey.

2. Top Filtering Bar

No matter which view you are in, you can use the Date Range, URL Search, and Volume Thresholds (Metric Sliders) to refine the charts and tables instantly.


2.1 Date Range

Select specific periods to compare performance.


2.2 Segment & Intent Dropdowns

Instantly filter the dashboard to show only specific content clusters (e.g., only “private taxi service” or “jb” segments).


2.3 URL Path Search

Use the “Contains” field to find a specific page or directory (e.g., searching for “/price-guide/”).


2.4 Metric Sliders (Impressions & Clicks)

Quickly isolate content based on volume. By setting minimum or maximum thresholds—such as showing only pages with over 500 impressions—you can instantly filter out noise and focus on your highest-traffic URLs.

3. General Overview Chart

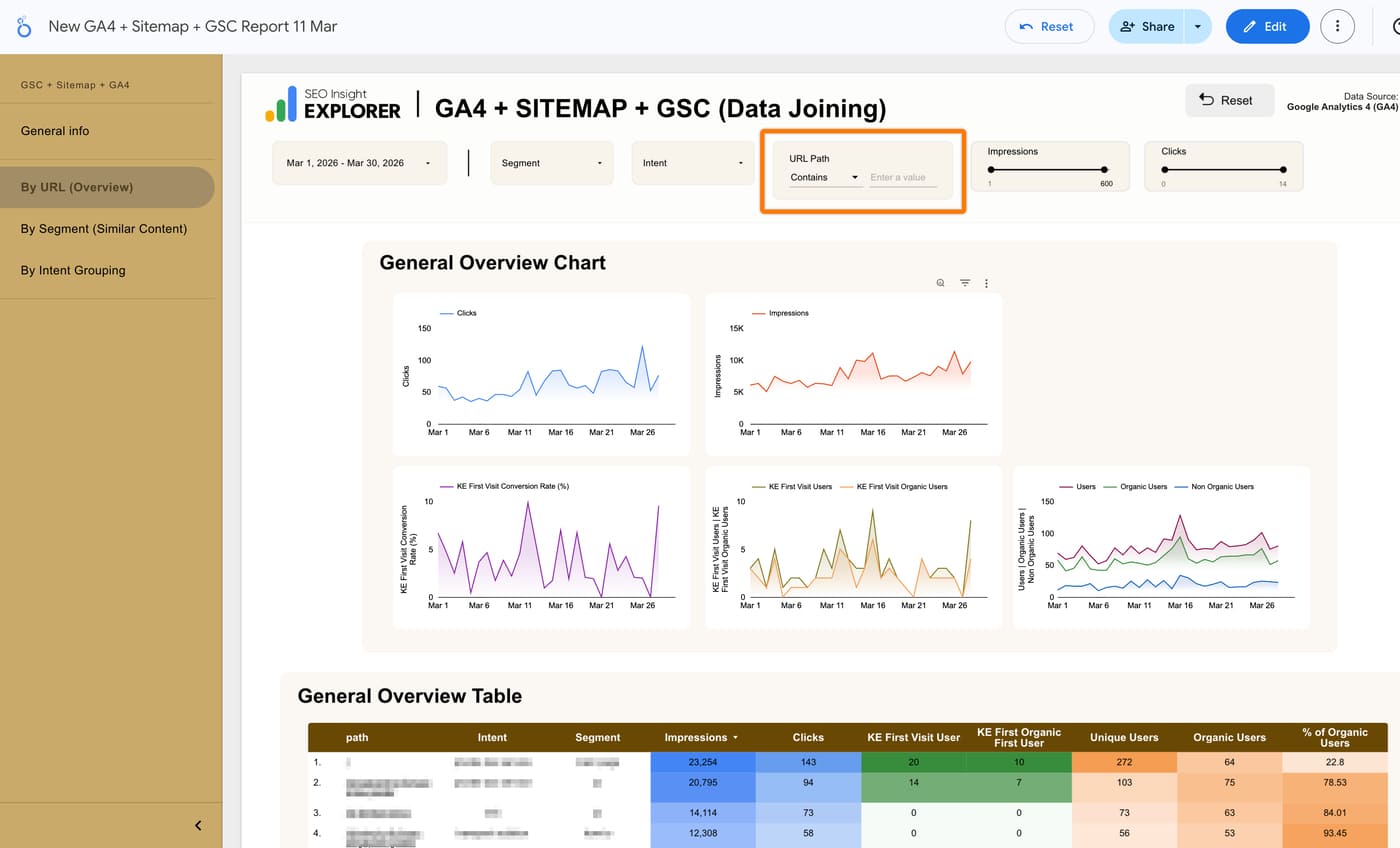
These four line charts provide a customizable time-range snapshot of your performance, allowing you to select the specific timeframe you wish to analyze.

  • Clicks & Impressions (GSC): Tracks visibility and click-through trends over time.
  • KE First Visit Conversion Rate % (GA4): Shows the percentage of visitors completing your set Key Events (conversions) over time.
  • KE First Visit Users vs. KE First Organic First User: Compares total conversions against your organic user growth to see if your “quality” of traffic is improving.
  • Users Breakdown: Visualizes the total mix of Organic Users vs. Non-Organic Users to show how dominant search is for your traffic.

4. General Overview Table (The URL Deep-Dive)

The table is the core of this view, organized by the specific URL path. Here is what each column tells you:

ColumnData SourceFeature Description
Path (URL)Gsheet (SEO Sitemap)SEO content page URL.
Intent & SegmentGsheet (SEO Sitemap)Your own content grouping definition.
Impressions & ClicksGSC BigqueryThe raw impression and click metrics from Google Search.
KE First Visit UserGA4 BigqueryThe total number of “converted users” of their very first visit URL
KE Organic First UserGA4 BigqueryThe total number of “converted users” on their very first visit URL (Users from Organic search).
Unique / Organic UsersGA4 BigqueryTotal Unique and Organic users. 
% of Organic UsersCustom FieldShows what percentage of organic users compared to total users. 

Why This One-Page Feature Is Powerful:

  • Eliminates “Tab-Switching”: This report solves the frustration of jumping between Google Search Console and GA4. By joining Search and User data automatically, it shows you Intent (Strategy), Clicks (Visibility), and Key Events (ROI) in a single horizontal line.
  • URL-Centric Analysis: Standard GA4 reports can be difficult for SEO teams to navigate. This custom view prioritizes the URL path, making it much easier to see exactly which specific page needs optimization.
  • Identifies High-Value “Hidden Gems”: You can quickly find pages that have a high number of Key Event (KE) First Visit Users even if they have fewer clicks. For example, a page with only 94 clicks might drive 14 conversions—proving it is a high-ROI page that deserves more traffic.
  • Spots Content Gaps Instantly: If a page shows high impressions but low organic users, you have identified a clear gap and know exactly where to optimize for a better click-through rate.

Request Access