Replace fragmented GSC + GA4 workflows with unified SEO content analytics that are built for the strategic SEO content team.
Monitor entire content portfolio from high-level topic groups down to individual pages in just 15 minutes daily
✅Problem 1: Default GSC / GA4 UI Not Built for SEO Content Teams
GSC and GA4 aren’t Designed for Content-Level SEO Monitoring
Google Search Console was built to help webmasters understand technical search performance—crawling, indexing, and basic query data. GA4 was designed for general marketing analytics—user behavior, session tracking, and conversion funnels.
Neither tool was purpose-built for SEO content teams who need to:
- Monitor hundreds or thousands of individual content pages
- Track content group performance over time
- Connect search visibility to actual business outcomes
- Make strategic decisions about content investment
The result? You’re forcing general tools to solve specialized SEO content management problems.
✅Problem 2: Default GSC / GA4 UI Incomplete Insights

The Cost of Keeping GSC and GA4 Separated
When you analyze GSC and GA4 in isolation, you’re only seeing half the story:
- GSC shows: What queries brought users to your site, impressions, clicks, and average position
- GA4 shows: What users did after arriving and conversions
What you can’t see:
- Which content group actually drive conversions (not just traffic)
- Which content topics generate the most valuable user actions
- The complete user journey from search query to key-event
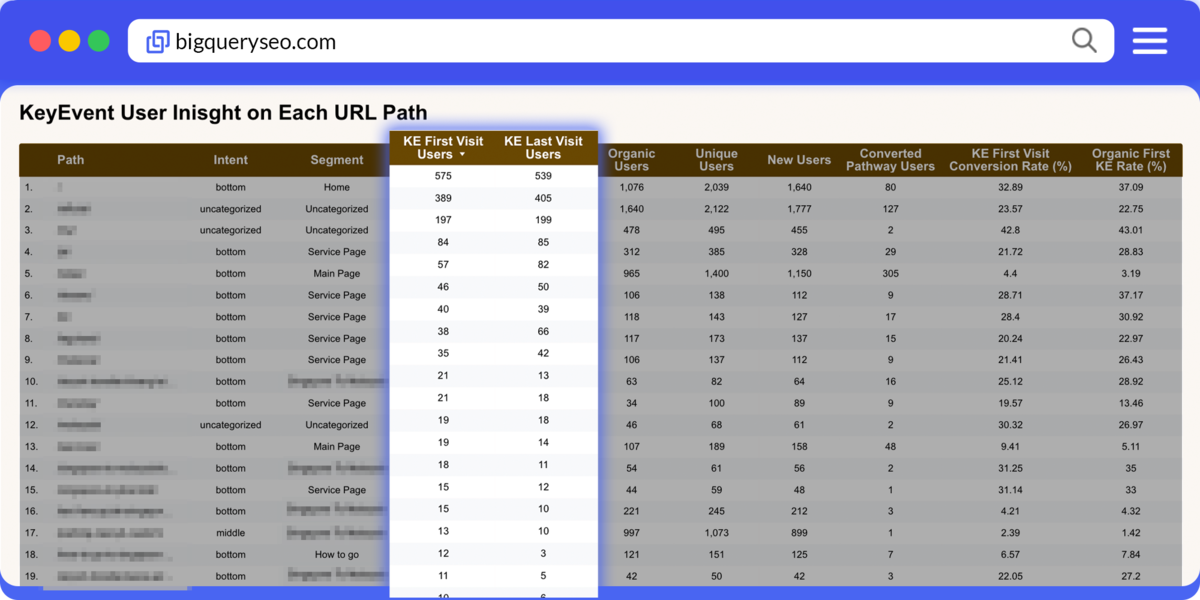
- Key Event Performance by Content Group: Analyze which content topics deliver the highest key-event returns and leverage query-level insights to guide future SEO content strategy or idea.
Critical blindspot: You might celebrate a blog post that ranks #1 and gets 10,000 clicks, but if it generates zero conversions while a #5 ranking page with 1,000 clicks drives 50 conversions, you’re optimising the wrong content.
✅Problem 3: SEO Content Overload Without Clear Priorities
![]()
The SEO Team’s Daily Struggle:
You’re drowning in content decisions with no clear framework:
- Too many pages to monitor: 500, 1,000, or 5,000+ URLs, impossible to review individually
- Constant publishing pressure: Team expects 10-20 new articles daily/monthly
- Unclear priorities: Which existing content deserves updates? Which pages are worth maintaining? Which topics should you double down on?
- Resource allocation guesswork: Should you create new content or strengthen existing high-performers?
Without content grouping and performance hierarchy, every page feels equally important (or equally overwhelming). You end up:
- Publishing more content to hope for more traffic shows in GSC UI (because it’s easier than strategic analysis)
- Randomly updating pages based on gut feeling
- Missing opportunities to maximize ROI from your best-performing content clusters
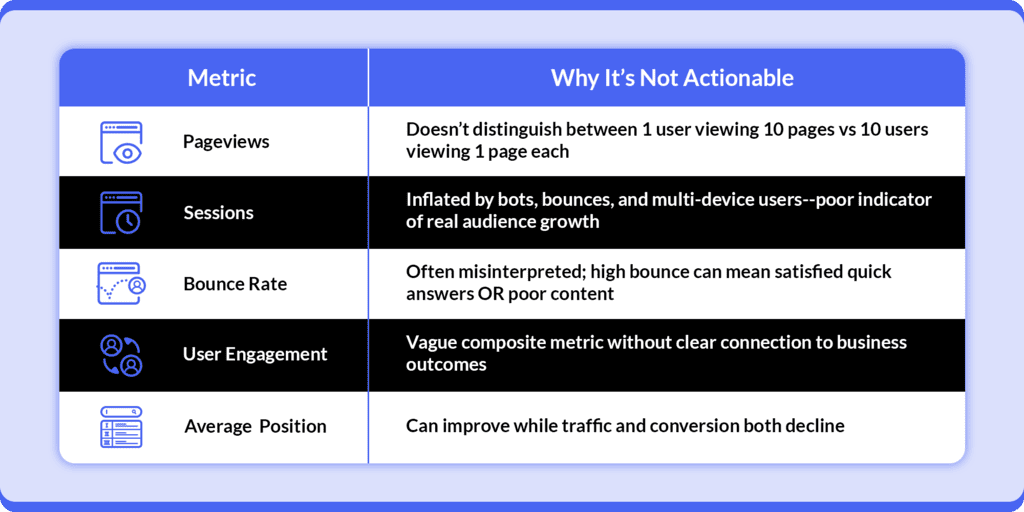
✅Problem 4: Vanity Metrics That Don’t Drive Decisions
Why Standard Metrics Fail SEO Content Strategy
The metrics most teams obsess over don’t actually inform content decisions:
✅Problem 5: The Wrong Way to Merge GSC + GA4 Data
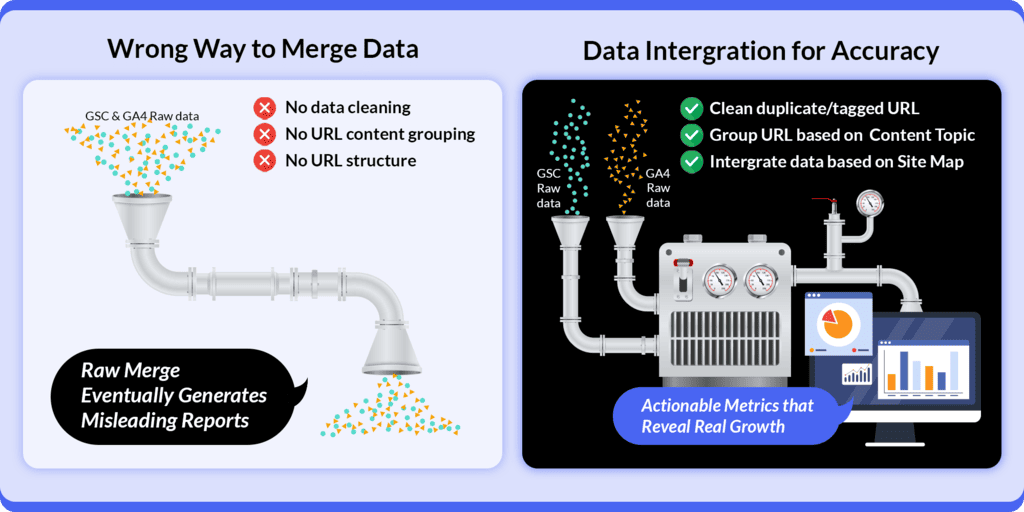
Common Misconception: GA4 and GSC URL Matching = Data Integration
GA4 and GSC don’t just report clean URLs—they generate thousands of parameterized URL variants from tracking and campaign data, making simple URL matching unreliable.
This approach misses critical SEO context:
1. No Data Cleaning or Validation before matching
- Duplicate URLs with tracking parameters (Example:
?utm_source=) - Trailing slash inconsistencies (
/pagevs./page/) - Ad Tracking (/page?gclid=123abc) and etc.
2. No Content Grouping for SEO Team Workflows
- Individual page URLs don’t map to how teams plan content strategy
- No way to see topic cluster performance
3. Not Designed to Merge with Your SEO Content Sitemap
- Your sitemap reflects your strategic content architecture
- Basic URL matching ignores content types, user intent, and topic relationships
- No alignment with how you actually plan, publish, and prioritize content
You need analytics designed for SEO content strategy, not general marketing dashboard.

Traditional GSC and GA4 setups create a data collection problem disguised as an analytics solution.
You have numbers, charts, and dashboards, but you still can’t confidently answer:
“Which content groups should we prioritize this quarter?”
“Is our content strategy actually driving business growth?”
“Where should we allocate our content team’s limited time?”
How we do it Differently and design for SEO Content Team
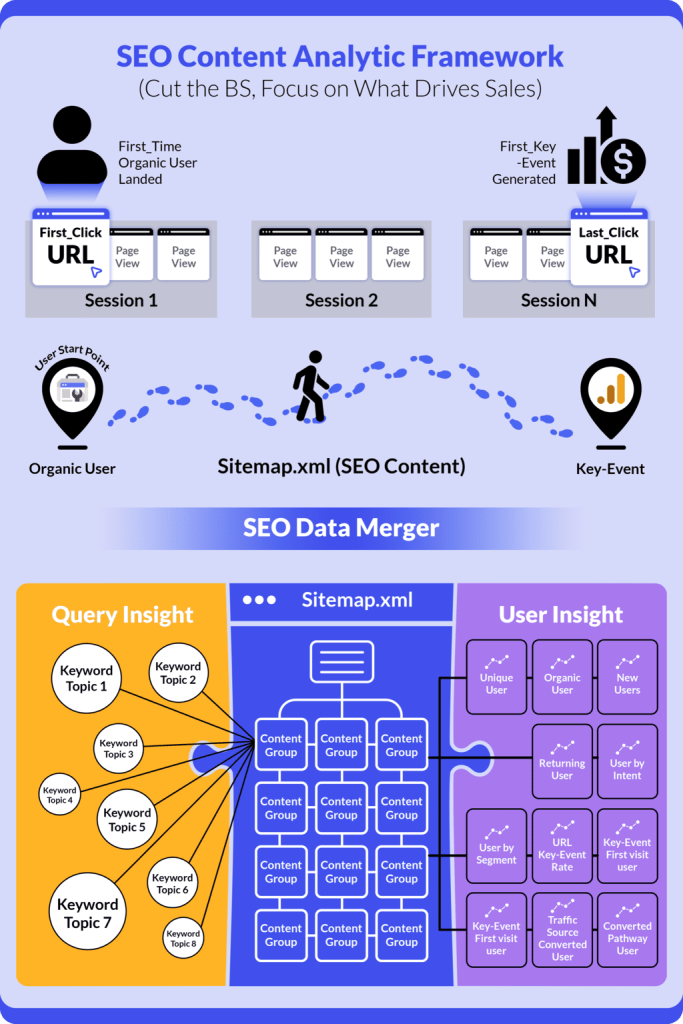
✅Topic 1: Unified Dashboard: GSC + GA4 + Sitemap Integration

Why Traditional Isolated Dashboards Fail: Most SEO teams waste hours switching between Google Search Console, GA4, and spreadsheets trying to piece together a complete picture. Each platform shows different data, requiring manual exports and complex joins that often miss critical context.
How Integrated Analytics Works Better: Our solution merges GSC search data, GA4 user behavior, and your content sitemap into one unified view. This means you can:
- Start broad, drill deep: Begin with high-level content group performance, then click through to analyze individual page metrics
- Get semi-custom insights: Built-in filters and user inputs let you create analytics views that match your specific SEO content structure—without needing SQL or technical skills
- Save hours daily: No more exporting CSVs, matching URLs manually, or building pivot tables
Real-World Example: Instead of checking GSC for impressions, then GA4 for conversions, then your sitemap for content categories—see all three dimensions together. Instantly spot that your “Product Comparison” content group gets 50K monthly clicks but drives only 10 conversions, while your “How-To Guides” get 20K clicks but drive 150 conversions.
Free Setup
✅Topic 2: Accurate Organic Click Data (Including Anonymized Clicks)
The Hidden Data Problem: Google Search Console’s default interface has a dirty secret: when you apply any filter (by query, page, or date range), GSC automatically excludes anonymized clicks and impressions from your reports. These anonymous clicks often represent 10-30% of your actual organic traffic.
What Are Anonymized Clicks? When Google can’t associate a search query with user data (due to privacy protections), those clicks get anonymized. In GSC’s filtered views, this data disappears, giving you an incomplete picture.
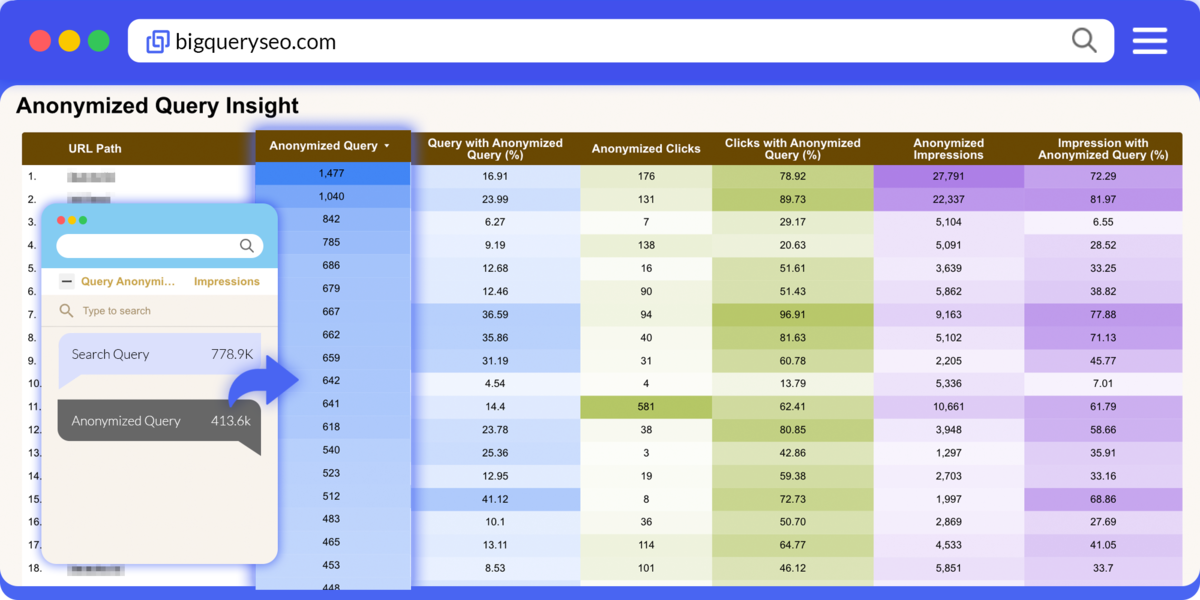
How We Solve This: Our analytics platform:
- Captures anonymized click data from GSC BigQuery Bulk Export before filters are applied
- Includes this data in all reports, giving you true total organic clicks
- Shows the difference: See both “attributed clicks” and “total clicks including anonymized”
Real Impact: You might think your blog post got 1,000 organic clicks this month—but it actually received 1,350. That 35% difference completely changes your ROI calculations and content prioritization decisions.
✅Topic 3: Actionable Metrics That Reveal Real Growth
Focus on What Matters:
1. Unique Users (Not Pageviews) Track individual people, not page refreshes. Growing from 1,000 to 1,500 unique organic users represents real audience expansion.

2. Single Key Event Tracking Don’t dilute focus across 20 conversion types. Define your ONE primary goal (newsletter signup, demo request, purchase) and measure relentlessly.

3. Key Event Attribution Models
- First-Click Attribution: Which content introduced users who eventually converted?
- Last-Click Attribution: Which content directly drove the conversion?
- Why both matter: “Ultimate Guide” pages might introduce users (first-click) while “Pricing Comparison” pages close deals (last-click)
4. Organic Unique User Growth Per Content Group See which topic clusters are actually growing your audience month-over-month, not just generating repeat traffic.

5. Traffic Growth Percentage Per Content Group Identify which content areas are trending up (+15% monthly growth) versus stagnating or declining, so you know where to invest time.
Action Decision: The Email Marketing content drives better conversion rates despite lower volume, time to create more content in this cluster.
✅Topic 5: Your Sitemap as the Analytics Backbone
Why Most SEO Analytics Fail at Strategy: Traditional tools show you what happened, but don’t connect performance data to your content strategy. You see numbers without understanding whether you’re executing your game plan effectively.
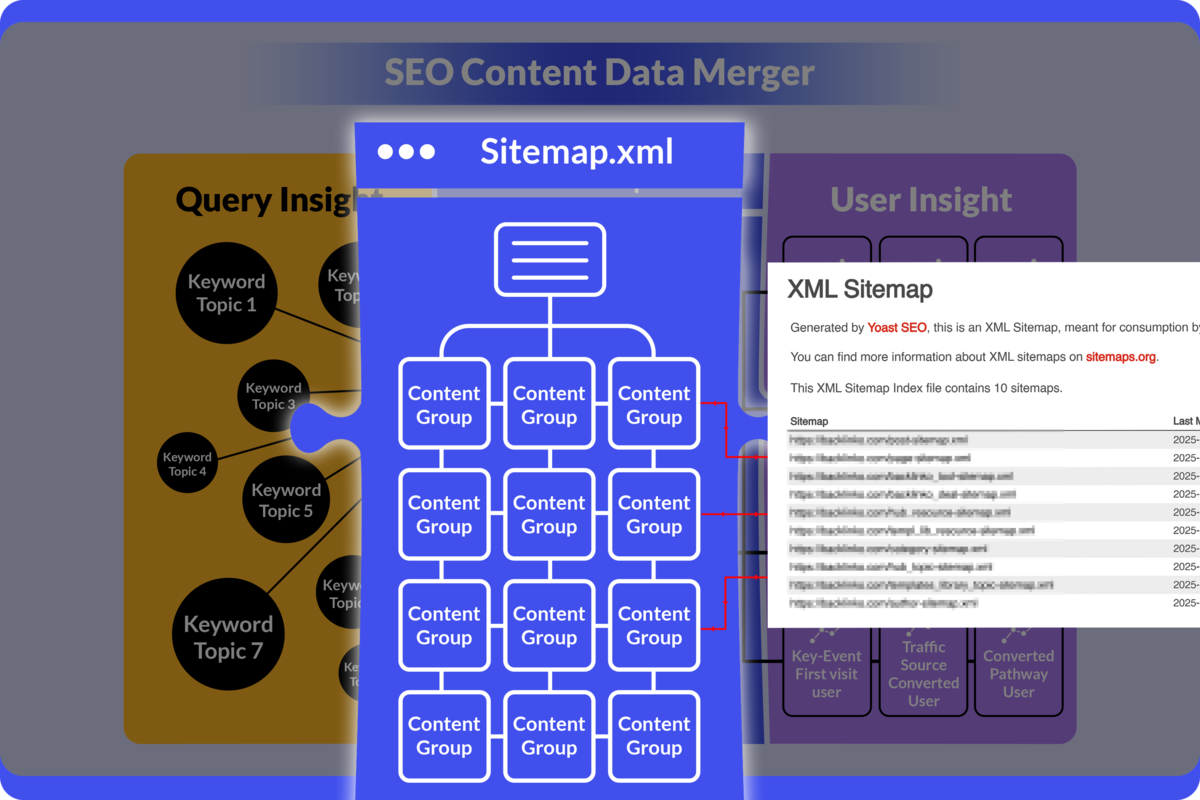
Content Sitemap = Your Strategic Blueprint: Your XML sitemap isn’t just for Google, it should reflect your content architecture and business priorities:
Determine Content Type & Purpose:
- ROI-Focused Content: Directly drives conversions (product pages, comparison guides, pricing pages)
- Authority-Building Content: Attracts links and builds expertise (research studies, industry reports)
- Traffic-Generating Content: Captures search volume (how-to guides, tutorials, FAQs)
Strategic Time Allocation: When your analytics follows your sitemap structure, you can:
- Allocate 60% of time to ROI-focused content that drives revenue
- Allocate 25% of time to authority content that builds domain strength
- Allocate 15% of time to experimental/new content areas
Prevent Content Dilution: Many SEO teams fall into the “more is better” trap, keep publishing constantly without strengthening existing high-performers. Sitemap-based analytics shows:
- Which content groups need reinforcement (internal linking, updates, expansion)
- Which content groups need consolidation (merge thin content, improve depth)
- When to stop publishing in oversaturated categories
Real Strategic Questions Answered:
- Are we investing enough in our best-performing content clusters?
- Is our “Product Features” group getting the love it deserves compared to our “General Blog” content?
- Should we pause publishing in Category X and update existing pages instead?
ROI-First Mindset: By doing so, your analytic SEO content dashboard must be able to define your own content group base on topics similarity and intent that suit your content plan. Every content group shows both traffic AND conversion contribution. Stop celebrating traffic wins that don’t move business metrics. Focus resources where they generate returns.