GSC report without the 1,000 row limit with URL- level impressions in the default GSC UI
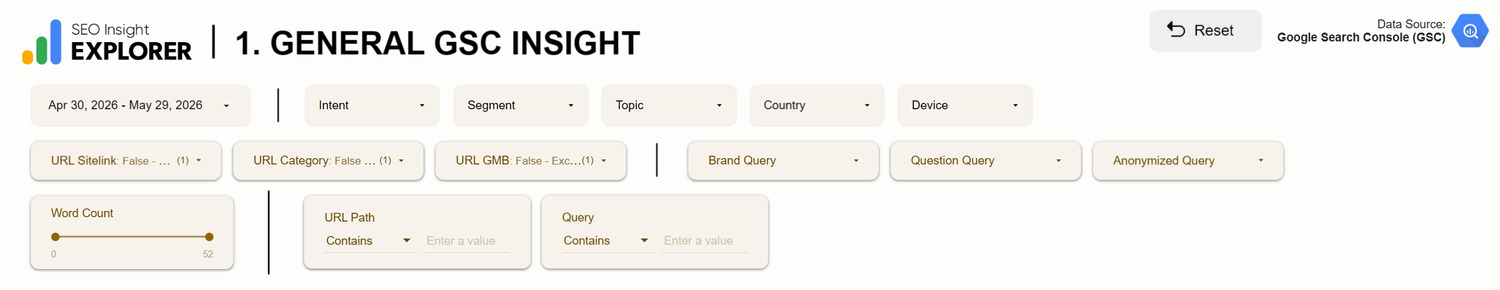
Default GSC UIs are designed for basic impression monitoring. Because the raw data is sourced from BigQuery bulk exports, I designed this dashboard to make it easy for the SEO team to read metrics that actually reflect the performance of each individual piece of SEO content, and even entire content groups.
The main filter system, as shown in the screenshot, is divided into 3 parts to allow for powerful, simple, and useful data sorting.
Part 1: Strategic Context & Audience
- Date Range, Intent, Segment, Topic, Country, and Device.
| Selection Tool | Practical Use |
1. Date Range | Date Range: Defines the period to analyze data (e.g., 7 days, 6 months, or year-over-year). Use it to measure the impact of content refreshes and track long-term growth. |
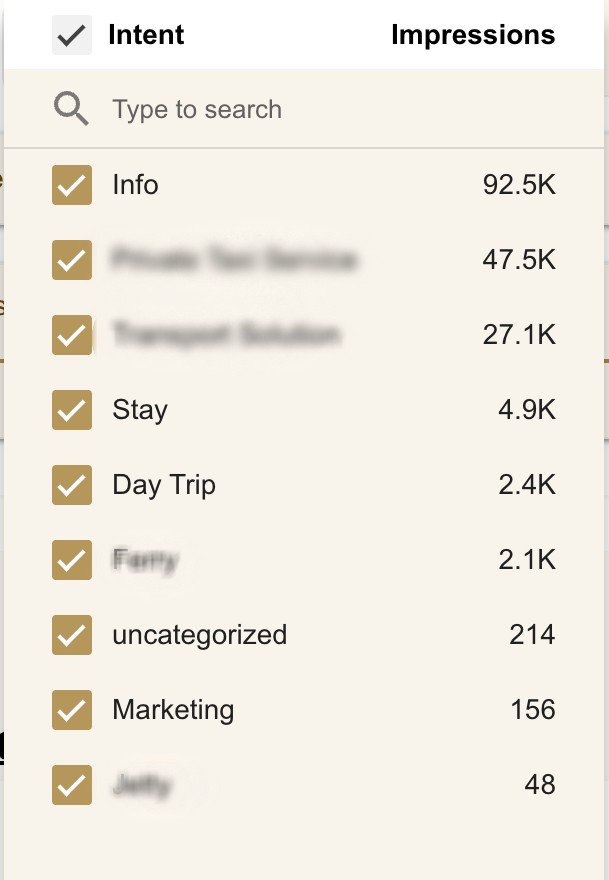
2. Intent
| Intent Groups (2nd Layer): Your secondary filter. You must manually group content by Action-Based Intent (e.g., Researching, Comparing, Ready to Book). Use it to identify specific human behaviors and where the user is in their journey. |
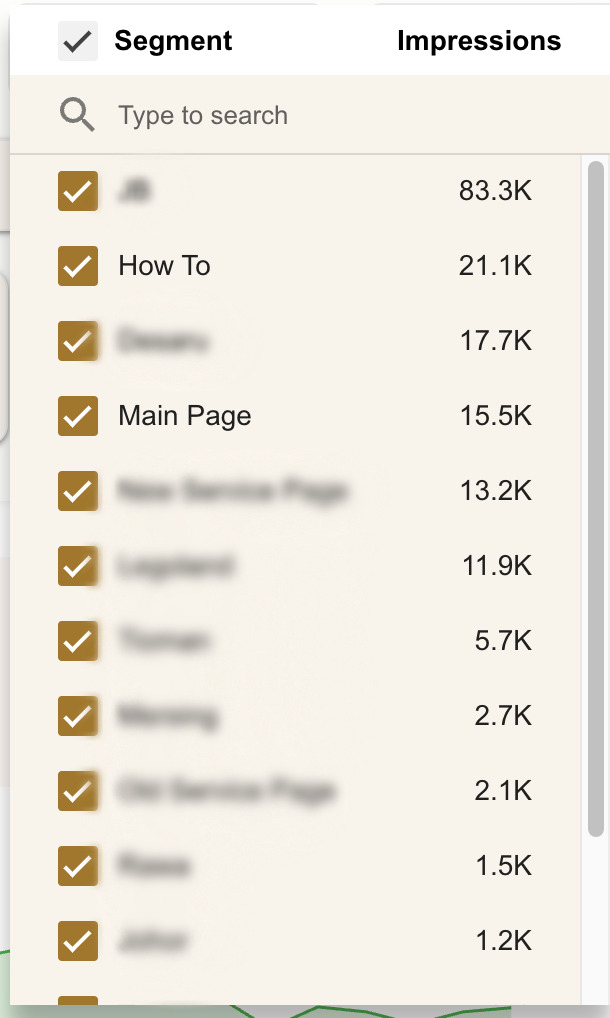
3. Segment
| Segment Groups (1st Layer): Your primary filter. You must manually group URLs by a shared theme (e.g., How-To, iPhone, Travel Guides). Use it to see how your similar contents topics are performing. |
4. Topic
| Search Queries Grouping: Automatically categorizes thousands of search terms into your main business topics (up to 20) based on a Priority Rule. Use it to ensure your most important keywords are tracked in the correct priority bucket.In the Topic dropdown bar, you will find two specific system-generated groups alongside your custom topics:
|
5. Country 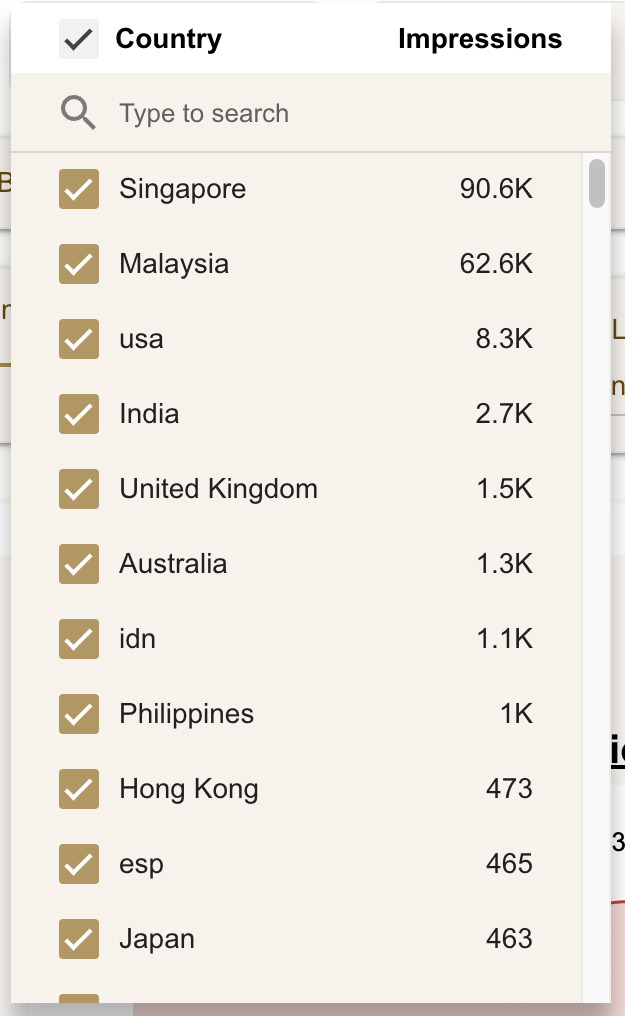 | Country: Filters by user location. Use it to see if your content is reaching your target market or just attracting irrelevant global traffic. |
6. Device
| Device: Desktop vs. Mobile split. Use it to check if your guides are being read on mobile. |


Part 2: Technical Authority & Attribution
- URL Sitelink, URL Category, URL GMB, Query Brand, Query Question, and Query Anonymized.
| Selection Tool | Practical Use |
1. URL Sitelink | By default, ‘URL Sitelink’ is set to false. Switch to True to isolate URLs that Google has chosen to display as “Sitelinks.” Use this to identify your most authoritative pages. |
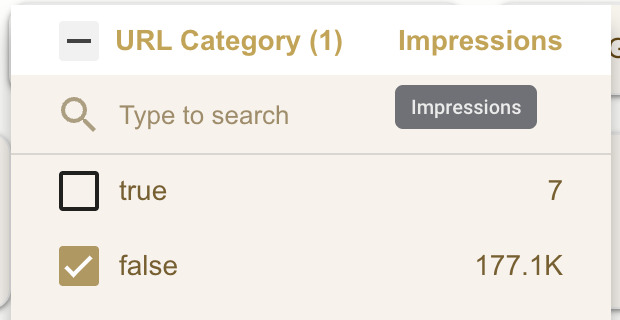
2. URL Category | By default, ‘URL Category’ is set to false, which excludes secondary paths (e.g., /page and /category). For SEO content analysis, these secondary paths are generally not necessary. Selecting ‘true’ will include these URLs in the scope. |
3. URL GMB | By default, ‘URL GMB’ is set to false. Switch to True to isolate URLs linked to your Google My Business profile. Use it to see how much “Local Search” intent is driving users to your site. |
4. Brand Query | Filters for searches that explicitly include your brand name. Use it to measure direct brand awareness and loyalty. |
5. Question Query | Filters for search terms phrased as questions (Who, What, How). Use it to identify specific help-seeking behaviors. |
6. Anonymized Query | Filters for traffic from search terms Google hides for privacy. Use it to focus only on the specific keywords you can see and optimize. |


Part 3: Performance & Granularity
- Word Count, Query Input and URL Path Input.
| Selection Tool | Practical Use |
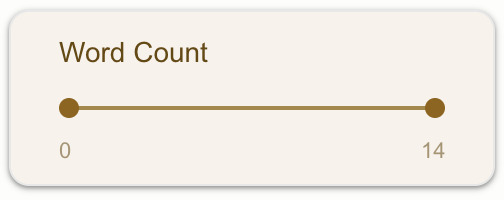 | Word Count: To sort or filter search terms based on query length. |
| Filters for specific URL structures. Use advanced matching (Contains, Starts With, Regex, In) to look at your /blog/ content separately from /services/. |
| Filters for specific words within search terms. Use advanced matching (Contains, Starts With, Regex, In) to drill down into specific keyword patterns. |


Part 4: Reset Report To Default
 | Reset Button: Located in the top-right corner, this button resets all selections, filters, and sliders to the report’s default state. |
Problem:
Most site owners assume the GSC default UI provides full transparency of their data. It isn’t designed for easily studying SEO content performance; it’s essentially a basic impressions analytics tool. By default (with no filters applied), the chart shows site-level impressions, not URL-level impressions.
Consequences:
You can’t accurately identify top-performing content or truly determine which pages get zero clicks. Eventually, your GSC data UI are not designed for SEO performance monitoring.
Solution:

An SEO content-performance analytics report that monitors each post/page without UI row limits. It allows you to view full URL- level data (including anonymized clicks) and combines queries, impressions, clicks, position, CTR, and unique queries in a single unified report with a selectable timeframe and graphs.