See which traffic source/medium brings users/key-event, not just pageviews.
Problem:
Standard GA4 reports show you how much traffic you get, but they don’t easily show you how good that traffic is. You might see 1,000 visitors from one source and assume it’s doing great, but you have no idea if those people ever intended to take action.
Consequences:
You end up wasting your budget or writing content for platforms that only bring in “window shoppers”. Without seeing the conversion gap, you can’t tell the difference between high-quality traffic and empty numbers.
Solution:
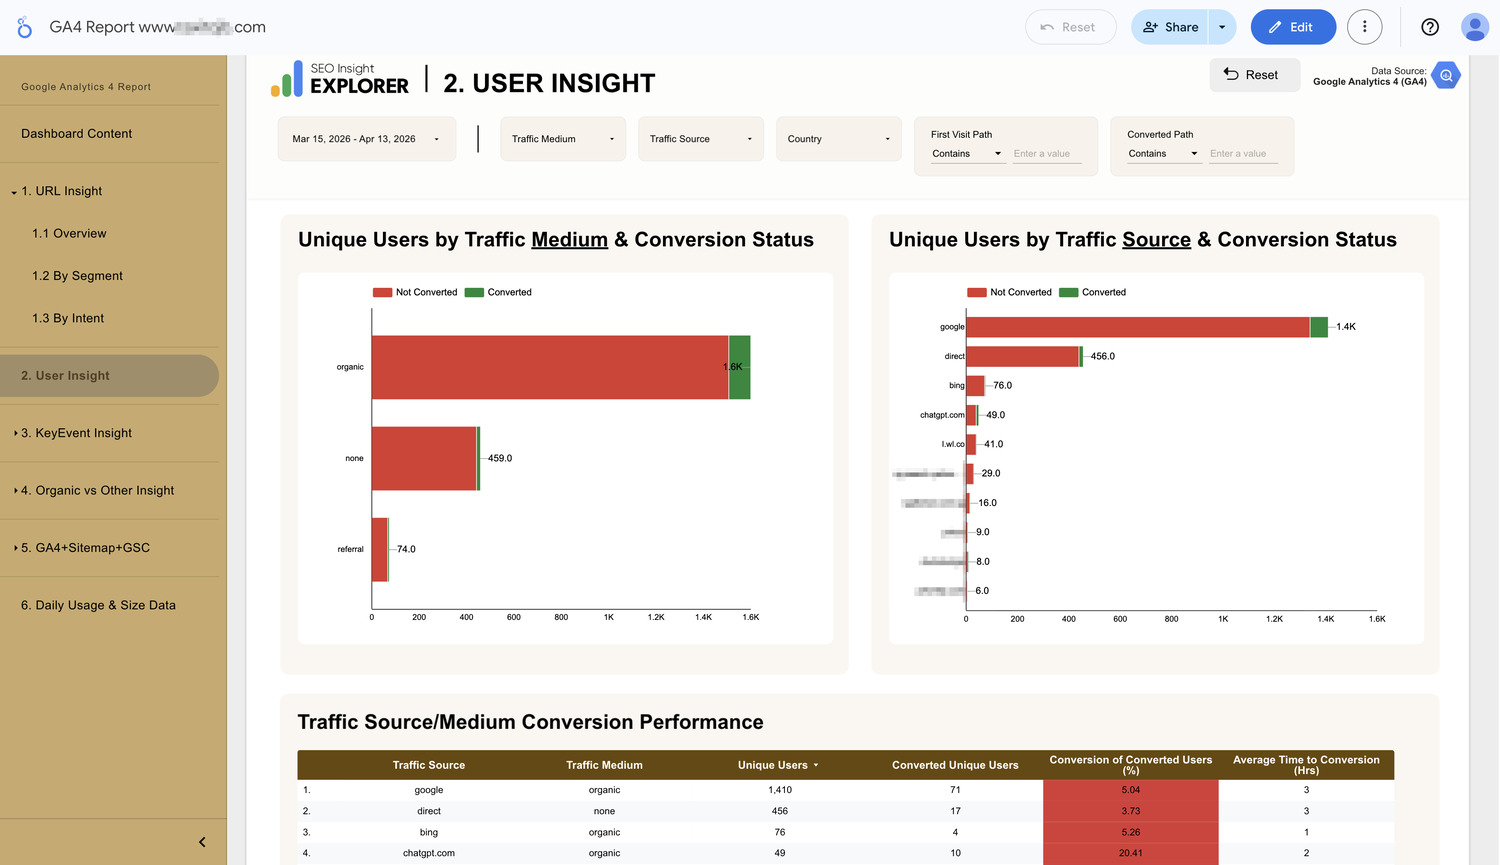
A report that splits your traffic by its Source (like Google or others source/medium) and immediately shows you the “Success Rate” for your SEO effort, if Google SEO didn’t bring you significant results for your business, you have to find out what the problem is.
- A visual bar chart that shows the total traffic for each source, with a green highlight showing exactly how many of those users actually converted. If a bar is all red, that source isn’t working.

- A simple percentage that tells you how likely a visitor from a specific source is to take action. This lets you compare different channels side-by-side.
- Average Time to Conversion (Hrs) tells you how long it takes a user from that source to make the first decision (KeyEvent). This helps you understand which channels lead to the fastest results.
