Solution:
Part 1: By Users
This solution allows for a side-by-side comparison of Organic vs. Non-Organic KeyEvent Users behavior. By mapping the specific paths users take, you can identify which pages act as “closers” and which act as “introducers.”

1. Initial Segmentation (Filters)
First, filter the report by Traffic Medium, Traffic Source, and Country.

Without these filters, you can monitor the data more specifically; applying them allows you to compare organic users against non-organic users with high precision.
2. Identifying Converted vs. Non-Converted Users
The report separates users into Organic and Non-Organic segments to answer critical performance questions:

- Behavior Before Conversion: You can see how many pages a user views before a Key Event. As shown in the chart, 99% of users convert within 1–2 pages.
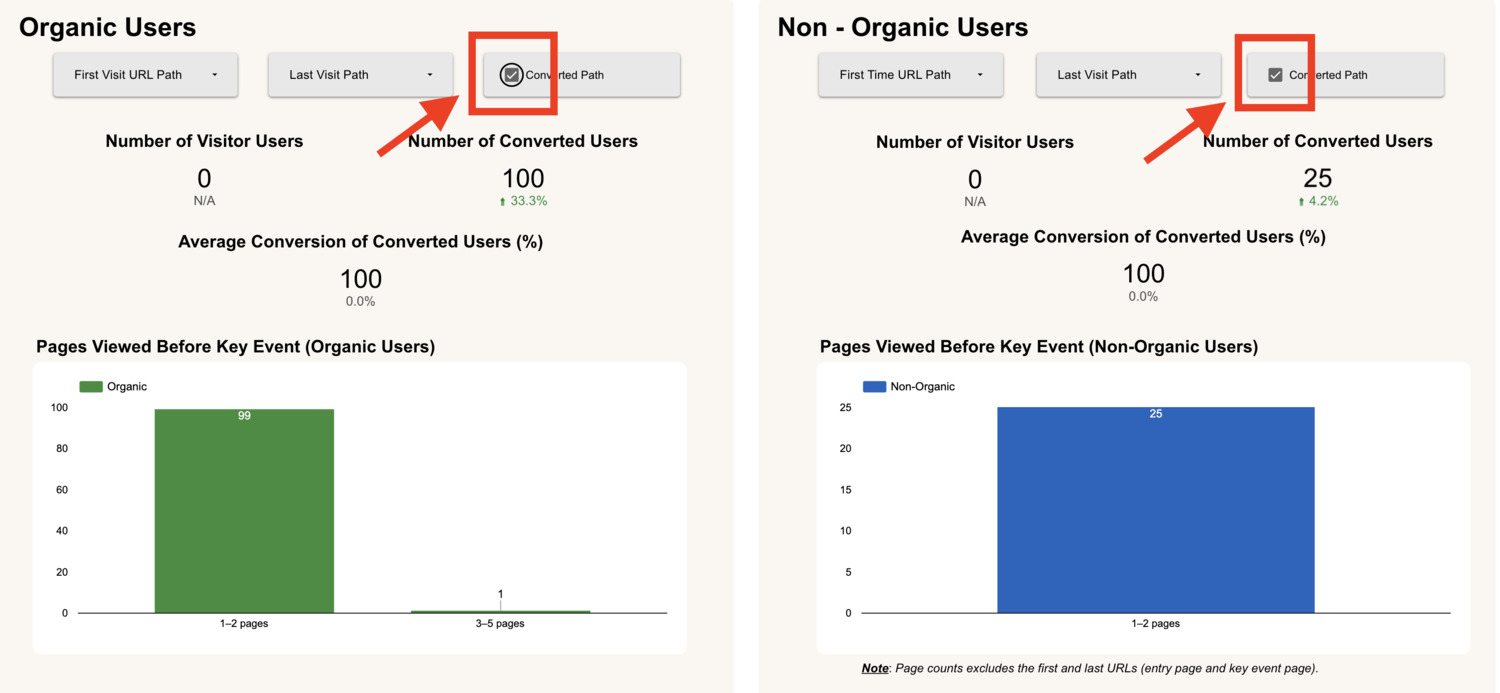
- Converted Path: You can tick the “Converted Path” option to eliminate these “null” results, showing only the paths that successfully led to a conversion. If a user enters through a First Visit Path but does not convert, the Last Visit Path will show as null in the table. (If you want to undo please press reset button on the report instead of uncheck the box)
- Defining Converted Users: If the First Visit Path and Last Visit Path are the same URL path, that user is considered a converted user for that specific page.
3. Tracking the Path to Conversion
Oftentimes, SEO teams monitor based on GA4 Standard tracking not specially designed to track what happens between a user’s entry and exit pages. This report records the specific First Visit URL and Last Visit URL to reveal the true journey:

- First Visit Path (The Hook): This is the very first page path the user landed on when they discovered the website. It identifies which content is attracting new audiences.
- Last Visit Path (The Closer): This is the final page path the user was on when they triggered a Key Event (Conversion). It identifies which content is successfully driving action.
- Time to Conversion: The report also tracks how long it took (in hours or days) for the user to move from that first visit to the final conversion.
Note: The Organic First Visit URL is critical for tracking SEO performance. We need to attribute conversions and KeyEvent results to the first URL that acted as an introducer, bringing in new organic unique users.
4. Side-by-Side Comparison Organic vs Non-oragnic
You can compare Organic and Non-Organic behavior side-by-side.

This allows you to compare the First Visit and Last Visit URLs between organic and non-organic users so that you know exactly which URLs are performing the best and which are performing the worst.
By looking at these entry and exit points, you can identify which specific URLs successfully attract and convert search traffic versus those that only work for other channels. This data makes it clear which pages need optimization to improve your overall SEO results.
Part 2: By URLs
While User Filtering is powerful, URL Filtering is often more intuitive and easier to act upon for content teams. I have intentionally omitted extra metrics to strip away the “noise,” keeping the report sharp and focused on the data that drives high-impact decisions.
1. Initial Segmentation (Filters)
First, filter the report by Segments, Intent, Country, and URL Path.

Using these filters helps you look closely at how specific pages are performing. It shows exactly how organic users interact with your pre-defined Segment Grouping and Intent Grouping so you can see what is working.
2. Side-by-Side Comparison: Organic vs. Other
You can compare Organic and Non-Organic behavior side-by-side to see which traffic source is performing best. This view follows a simple flow:

Step 1: Deep Dive Filters Within the charts, you can first filter the content by Intent or Segment grouping. This allows you to deep dive into specific topics you want to monitor or check in detail.
Step 2: Tracking Trends The charts show you the trend and fluctuation of your Organic and Non-Organic users. Monitoring these ups and downs over time helps you understand the current status of your traffic.
Step 3: Comparing Results in the Table Lastly, use the table to check Organic Users, % of Organic Users, and KeyEvent Users (Organic vs. Non-Organic). You can also compare the First Visit and Last Visit conversion rates for both sources.
This side-by-side comparison immediately shows you which URLs are the best and worst performers. By seeing which pages successfully convert search traffic versus those that only work for other sources, you can know the condition of each URL immediately and decide where to optimize.
3. Tracking Key User Metrics
This report breaks down every URL path to show you exactly where your traffic comes from and which pages are actually doing the work:

- Unique Users: The total count of individual visitors who viewed that specific page.
- Organic Users: The count of visitors who found the page through search engines like Google.
- % of Organic Users: This shows the percentage of the page’s total traffic that comes from SEO.
- Organic First Visit KE Users: The count of first-time visitors who came from unpaid search results such as Google or Bing and completed a Key Event
4. Identifying Conversion Performance (Introducer vs. Closer)
The most critical feature of this report is the breakdown of conversion rates at the URL level, distinguishing between the “Hook” and the “Closer”:

- Organic First Visit KE Rate (%): This measures how many users landed on this URL as their very first touchpoint and eventually converted. A high rate here identifies a powerful “Introducer” that attracts high-quality, relevant leads.
- Organic Last Visit KE Rate (%): This measures how many Organic users were on this specific URL when they completed their conversion. A high rate indicates a “Closer” that effectively pushes users to take the final action.
- Non-Organic Users: The count of visitors who found the page through other sources, such as social media, direct links, or ads.
Note: The Organic KeyEvent Insight report is placed directly under KeyEvent User Insight for a specific reason: once you understand your overall conversion volume, the next logical step is to dive into User and URL behaviors. This structure provides a much clearer picture of how Organic and Non-Organic traffic actually behave in relation to your SEO or business goals.
In conclusion, at the end of the day, the most important question for any SEO strategy is: Which URLs (SEO Content) are actually converting?
This report ensures you stay focused on the specific pages that deliver real business value rather than getting lost in minor data points.