Track performance shifts across your custom Segments, Intents, and Topics
Problem:
This makes it difficult to see the “big picture” of which specific part of your seo content is actually shifting. So that you can pay attention to those content groups or query groupings has big fluctuations increasing and decreasing over a period of time.
Consequences:
When traffic drops or spikes, you are left guessing the cause. You can’t tell if a specific segment is losing traffic, if a certain user intent is gaining interest, or if a new topic is driving growth. Without clear “before and after” data for your custom groups, you miss critical trends that could help you pivot your seo growth and effort.
Solution:
The General Overview Charts provide a visualization of search performance changes for Clicks, Unique Queries, Position, Impressions, and URL Path. These charts are consistent across the Change Insight (By Segment, By Intent, and By Topic) reports, allowing you to see the big picture of your data.
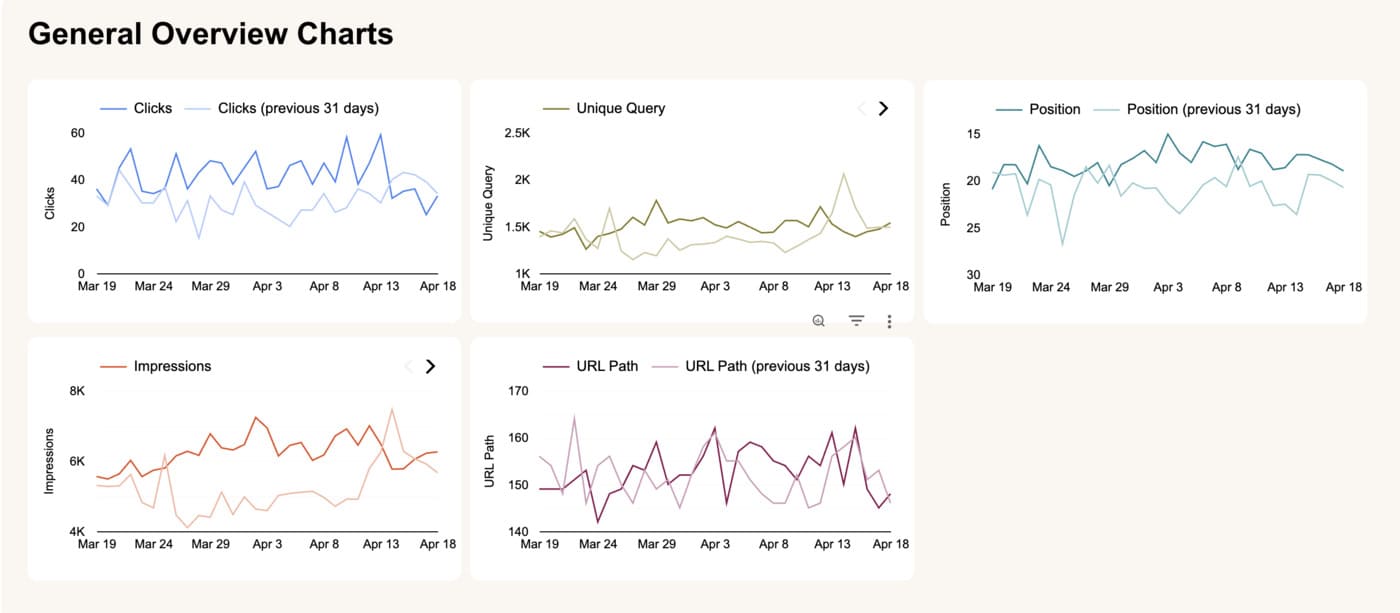
By comparing your currently selected time range against the immediately preceding period, you can instantly identify whether overall site visibility is growing or declining.
Solution:
Part 1: By Segment
The Change Insight (By Segment) report tracks performance fluctuations across Impressions, Clicks, FullPath, and Unique Query counts. It calculates the percentage of change (% Δ) for each metric by comparing your active date range against the preceding period of equal length.
The comparison is dynamic: if you select a two-week timeframe, the report compares it against the preceding two weeks; if you select one month, it compares it against the previous month, and so on.
These insights are generated based on the specific segment groupings you have defined within the SEOIE App. This allows you to:
- Instantly see how your different segment groups are performing. This helps you identify content groups are gaining search visibility and which require a strategic shift.
- Use the percentage of change (% Δ) to quantify improvements or declines. A high positive % Δ indicates that the content within that specific segment is successfully gaining traction.

- Click any Segment in the table to filter the Breakdown by Page (URL Path) list. This reveals the specific URLs and the number of different search terms (Unique Queries) driving the change, allowing you to see exactly which pages are the most successful within that segment group.
Part 2: By Intent
The Change Insight (By Intent) report displays the growth or decline in Impressions, Clicks, FullPath, and Unique Query counts for your selected timeframe. It also tracks the percentage of change (% Δ) for each of these metrics by comparing your current selection to the previous period of the same length.
The comparison is fully dynamic based on your selection:
- If you select a 1-month timeframe, the report automatically compares it to the preceding month.
- If you select a 3-month timeframe, it compares the data against the previous 3-month period.
- This logic applies to any range, ensuring you are always comparing equal blocks of time.
These insights are generated based on the specific Action-Based Intents you have manually grouped within the SEOIE App.

This allows you to:
- Quickly see which user behaviors (such as “Research,” “Compare,” or “Book Now”) are driving the most growth or which areas need attention.
- Use the percentage of change (% Δ) to measure how your content updates are moving the needle. A positive % Δ shows that your URLs within that specific intent are gaining authority.
- Click any Intent category to update the Breakdown by Page (URL Path) list. This allows you to identify the exact pages responsible for the shift in performance, making it easy to replicate successful SEO tactics across other segments.
Part 3: By Topic
The Change Insight (By Topic) report shows the topics based on priority you predefine in the SEOIE App with Impressions, Clicks, and FullPath counts for your selected date frame. It also shows the percentage of changes from your selected date range if you select a 1-month range, a 3-month block, or a custom date range with the previous date frame.
The Change Insight (By Topic) report displays the topics based on the Topic Priority you predefined in the SEOIE App, showing Impressions, Clicks, and FullPath counts for your selected timeframe.
It also shows the percentage of change (% Δ) for Impressions, Clicks, and FullPath by comparing your selected date range to the previous period of the same length.
For example, if you select a 1-month range, a 3-month block, or a custom date range, the report automatically compares those metrics against the previous period of the same duration.
This allows you to:
- View data organized by your custom Priority Levels (Priority #1, #2, etc.). Since SEOIE automatically sorts queries into your most important topics first, you can focus on the performance of your primary business goals.
- Instantly see which main business topics are growing in visibility and which ones require immediate attention or content refreshes.

- Click any Topic in the table to update the Breakdown by Query list. This reveals the specific search terms and URLs driving the change, so you can replicate success or fix losses within that high-priority group.